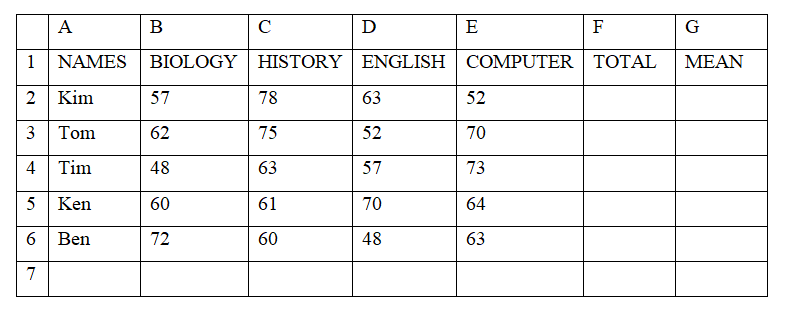
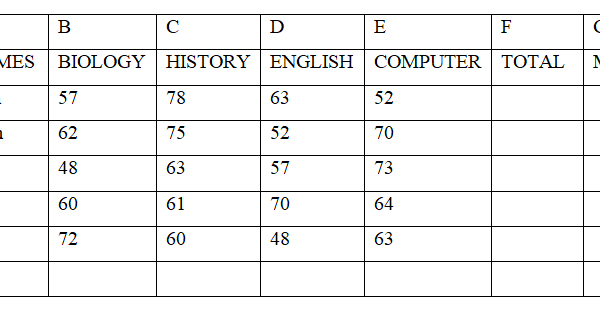
The following is a list of students and their marks they scored in the various subjects

(i) Write a formula to calculate the following: (3marks)
(a) Total marks for Ken
= sum (B5:E5) OR = B5+C5+D5+E5
(b)Mean mark for Tim
= Average (B4:E4)
(c) The highest score for Kim
= max (B2:E2)
(ii) Write the formula to count all the computer students with marks greater than 60. (2marks)
= COUNTIF(E2:E6,”>60”)
(iii) Give the functions of the following types of charts. (3marks)
(a) Pie chart
shows contribution of certain items to a grand total
(b) Line graph
shows the trends and checking changes of value over time
(c) Bar graph
it is used to compare values at given point in time
people found this article helpful. What about you?
Subscribe
Login
Please login to comment
0 Comments

